Introducing Area IQ: The Smarter Way to Research UK Property Before You Buy, Sell, or Invest
Published by Property Insights UK · April 2026 · 6 min read
Imagine bidding £20,000 over asking on a flat, only to find out the one downstairs sold for £30k less six weeks ago. What if you could see all the real market data before you bid? Similar properties sold nearby, annual growth rates, market activity, or perhaps price per sqft?
That is exactly the problem Area IQ was built to solve.
Area IQ is a free UK property intelligence dashboard that gives you real sold prices, five year market trends, comparable evidence, and an indicative valuation, all from HM Land Registry registered completions. Search any UK postcode district and within seconds you have the full picture of what buyers have actually been paying, filtered your way, with no guesswork and no fabricated estimates.
Here is everything you get inside Area IQ and why it matters before your next property decision.
What Is Area IQ?
Area IQ is the property research tool inside Property Insights UK. It is designed for anyone who needs to understand a UK property market before making a decision: buyers who want to know what to offer, sellers who want to price with confidence, investors tracking price momentum, and agents who need clean comparable evidence for client reports.
Unlike property portals that show asking prices, Area IQ shows completed sale prices: the actual amounts recorded at Land Registry when a property legally changed hands. The difference between an asking price and a completed sale price can be tens of thousands of pounds. Area IQ starts from the number that actually matters.
Search any UK outward postcode: SK7, M20, E17, SW11, or any other district. The full dataset loads in seconds.
Filters and Market Overview: Your Market, Not a Blended Average
The first thing you see inside Area IQ is the market overview, a headline set of statistics for your chosen postcode district. But unlike most property tools that show one blended average across all property types, Area IQ gives you full control over what those numbers represent.
Filter by property type: detached, semi-detached, terraced, or flat. Filter by tenure: freehold or leasehold. Filter by locality to drill into individual neighbourhoods within the district. Filter by time period: last 6, 12, 18, or 24 months, or the full five year picture.
Every filter updates every stat on the page simultaneously. The sales count, median price, average price, price per square metre, and annual growth rate all reflect your exact selection, not a blended figure that mixes a detached property with a flat and produces a number that accurately describes neither.
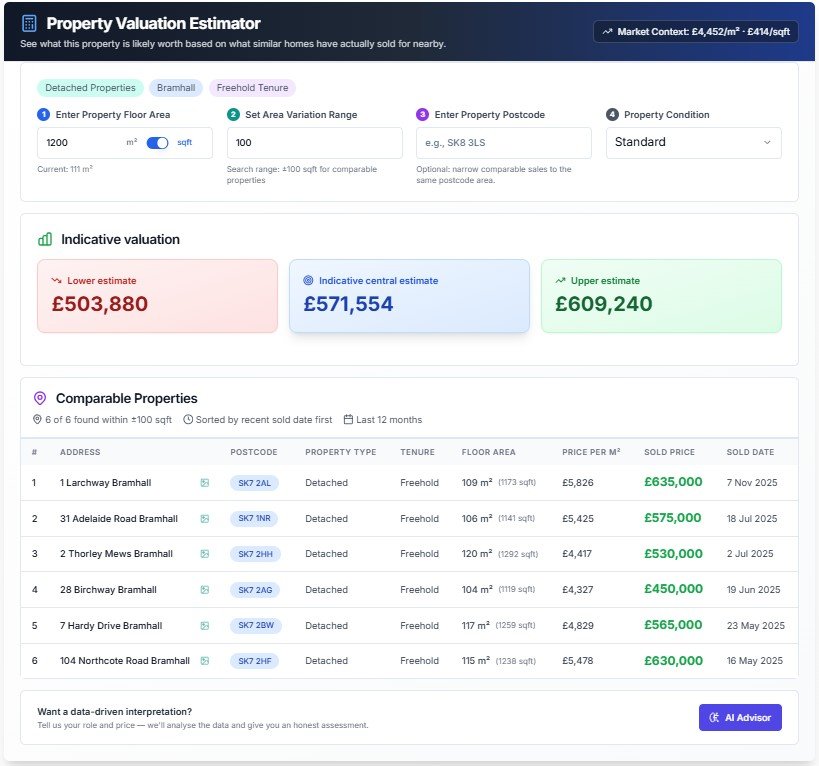
Property Valuation Estimator: A Value Range Built From Real Sold Data
The Property Valuation Estimator is the feature that most directly helps buyers and sellers answer the question that matters most: is this price fair?
Enter a floor area and the estimator finds every comparable property of similar size that has sold nearby in the last 12 months, filtered to match your selected property type and tenure. It calculates the median price per square metre from those comparable sales and applies it to your floor area, producing a lower estimate, a central estimate, and an upper estimate.
This is not an algorithm. It is not an AVM black box. Every comparable is listed in full: address, postcode, floor area, price per square metre, sold price, and sold date, so you can see exactly where the number comes from and judge for yourself whether the comparables are genuinely relevant to your property.
If the asking price on a property you are considering sits above the upper estimate produced by real comparable evidence, that gap needs an explanation. Either the property has features that justify the premium (condition, extension, garden, location on a premium street) or the seller is asking above market and you have a data backed basis for negotiation.
Statistical outliers in the comparable set are automatically flagged, so you can see which sales are genuinely anomalous and which represent the true centre of the market.
Sold Price Map: Understand the Geography of the Market
Numbers tell part of the story. Geography tells the rest.
The Area IQ sold price map plots every filtered transaction as a colour-coded pin on an interactive map. Green pins show lower-priced sales relative to your filtered view. Amber pins show mid-priced sales. Red pins show higher-priced sales. The colour coding is always relative to your current filter. It shows you where value sits within your specific search, not across the whole district.
Drag the map, scroll to zoom, and hover any pin for the full details: address, sold price, floor area where available, and sold date. Within seconds you can see whether higher-priced sales are clustering on specific streets, whether one side of a road commands a premium over the other, and where the pockets of value sit within your target area.
This kind of geographic intelligence used to require an estate agent to share it with you selectively. Area IQ puts it in front of you before you have even spoken to an agent.
Market Trends: Rising, Falling, or Flat?
Knowing what homes sold for last month is useful. Knowing whether prices have been rising or falling for five years is essential context for any serious property decision.
The Area IQ trend section plots average and median sold prices year by year from 2021 to the present, filtered to match your selected property type, tenure, and locality. You can see at a glance whether your target area is a rising market, a cooling one, or one that peaked in 2022 and has been drifting since, which is the story in many UK postcode districts right now.
Alongside the price trend, the sales volume chart shows how many completions were recorded each year. Volume is often the leading indicator that price trend data lags behind. When volumes fall significantly, as they have across much of the UK since 2022, it tells you that fewer buyers are competing for properties, which shifts negotiating power toward buyers before that shift shows up in the price data.
Transaction Data: Every Sale in Full
For buyers who want to go deeper, investors building their own models, or agents preparing client facing reports, Area IQ includes the complete filtered transaction table. Every sale in your selected view includes full details: address, postcode, property type, tenure, floor area, price per square metre, sold price, and sold date.
The entire table is downloadable as a clean CSV with one click. No reformatting required. Take it into your own spreadsheet, feed it into a valuation model, or include it in a market appraisal report for a client. The data is yours the moment you download it.
This is the same underlying data that property professionals pay significant fees to access through institutional data providers. Area IQ makes it available to anyone searching a postcode district.
Who Area IQ Is Built For
Buyers and movers use Area IQ to research a target area before viewing a property, check whether an asking price is supported by comparable evidence, and build a defensible case for the offer they want to make.
Sellers and landlords use it to anchor an asking price to real market evidence rather than an estate agent's optimistic assessment, understand how their property compares to recent comparable sales, and go to market with confidence in their pricing.
Investors use it to track price momentum and sales volume trends across multiple postcode districts, identify which property types are outperforming within a market, and build research packs for acquisition decisions.
Estate agents and advisers use it to generate clean comparable evidence quickly for client presentations, export transaction data for market appraisal reports, and show vendors exactly what similar properties have achieved in their area with the full data visible and verifiable.
The Data Behind Area IQ
Every price in Area IQ is a registered completion from HM Land Registry, the legal record of what a buyer actually paid at the point of exchange. Not an asking price. Not an automated estimate. What a buyer agreed to pay and what was recorded at the point of legal completion.
Floor area data comes from the Energy Performance Certificate register, the government's own database of property energy assessments which records floor areas for most UK residential properties.
There are no fabricated estimates passed off as transactions in the core tables. The indicative valuation is clearly labelled as indicative, the methodology is explained in full, and every comparable used in the calculation is listed so you can verify it yourself.
This transparency is deliberate. Property decisions involve significant sums of money and serious legal commitments. You deserve to know exactly where the numbers come from and what their limitations are.
Try Area IQ Free
Search your target area, apply your filters, and see what buyers have actually been paying before you make your next move.
Registering a free account gives you full access to searches, filters, the complete transaction table, CSV export, and the Property Valuation Estimator across every postcode district in England and Wales.
Search your postcode on Property Insights UK
Open Area IQArea IQ is provided by Property Insights UK for research purposes. It does not constitute financial, legal, or investment advice. For regulated valuations or binding decisions, consult a qualified professional.