
Areas. Sales. Insight.
Know the market before you buy, sell, or invest
Sold prices. Trends. Comparables. Valuations.
Buyers & movers
See what similar homes have sold for before you make an offer.
Sellers & landlords
Back your asking price with recent comparables and real evidence.
Investors
Track price trends and locality performance across five years.
Advisers & analysts
Filter, chart, and export clean transaction data for client reports.
Stop guessing. Start knowing.
Every offer and asking price is better when it starts with real data.
Search freeEverything inside Area IQ
Real screenshots from the dashboard. What you see below is exactly what you get after you search.
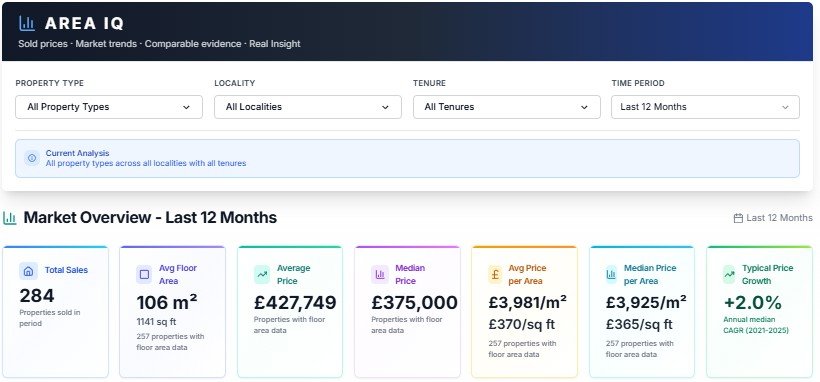
Your market, your filters. Not a one-size-fits-all average.
No blended averages mixing flats with detached houses. Every stat (sales count, median, £/m², growth) reflects your exact selection.
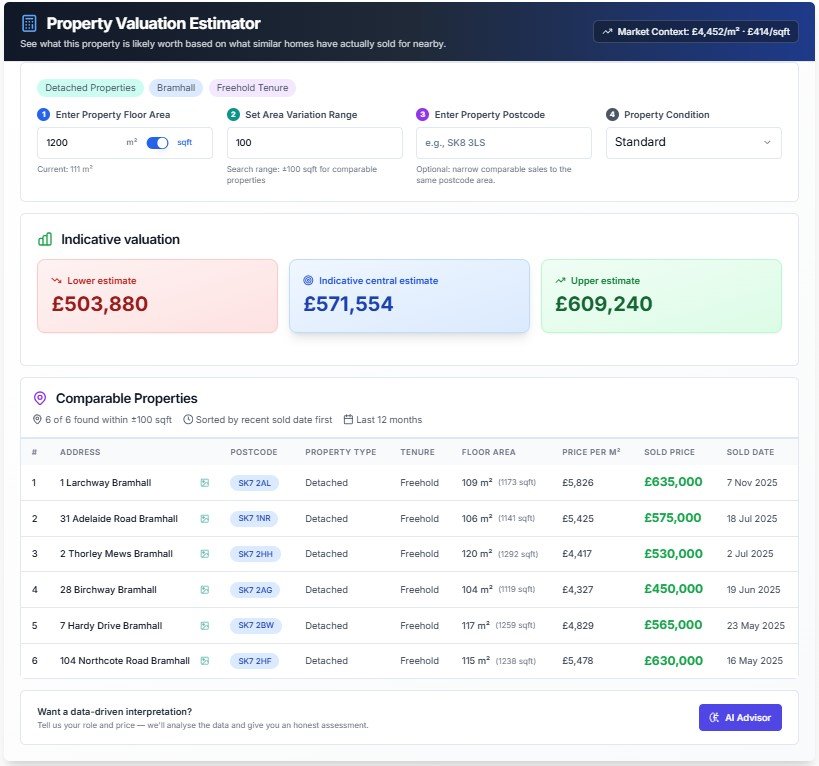
A value range built from real sold data, not an algorithm
Enter a floor area and see what properties of the same size have actually sold for nearby. Decide whether an asking price is fair, high, or low before you make an offer. Every comparable is listed so you can check the working yourself.
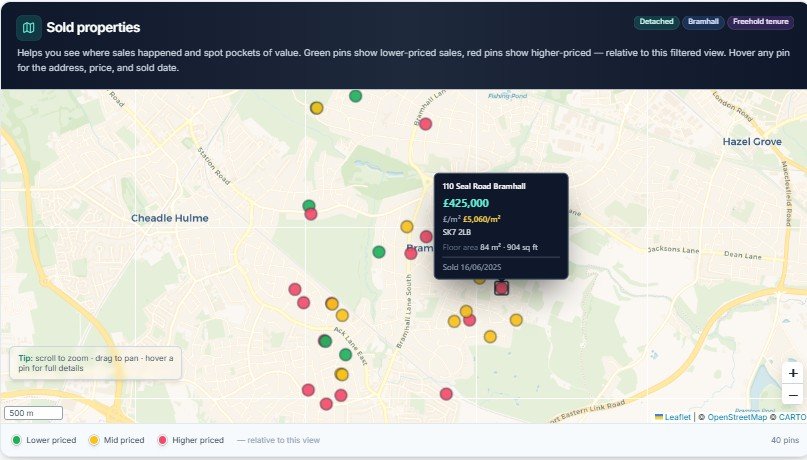
Every sale, plotted. Hover for the address and price.
See exactly where higher and lower-priced sales are clustering within your target area. Zoom into a specific street, hover any pin for the address, sold price, and date, and understand the geography of the market, not just the numbers.
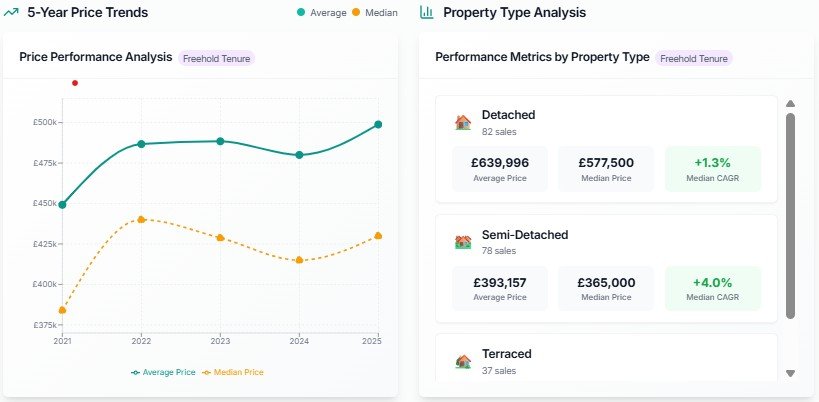
Rising, falling, or flat? See the five-year story.
Average and median prices plotted year by year, broken out by property type. Know whether you are buying into a rising market or one that peaked in 2022, before you decide what to offer.
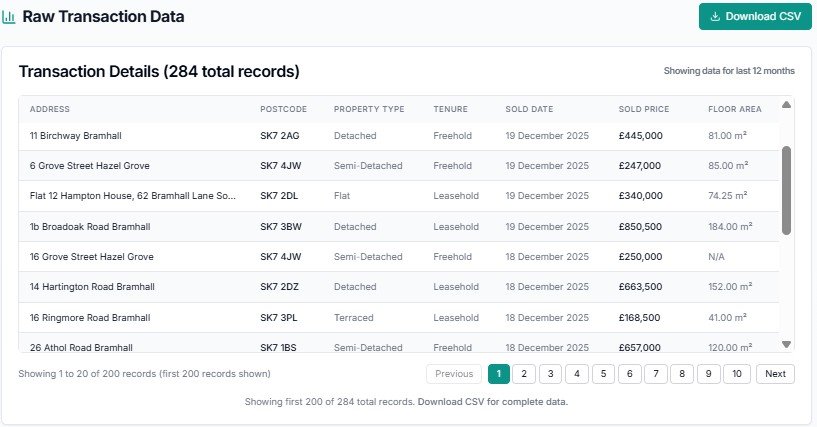
Every sale in full. Download and take it with you.
The complete filtered transaction list: address, sold price, floor area, price per square metre, and sold date, exported as a clean CSV. Use it in your own spreadsheet, include it in a client report, or feed it into your investment model. The data is yours the moment you download it.
Data you can stand behind
Area IQ is built around authoritative UK sources. You apply your own judgement, but you start from recorded sales completions, not guesswork or scraped listings.
- HM Land Registry Price Paid Data: actual sold prices and dates
- District and locality views derived from official completions
- No fabricated estimates passed off as transactions in the core tables